
Success can be defined in different ways. A positive pregnancy test, a confirmed pregnancy on ultrasound, or ultimately birth of a (live) child.
Clinics often report success rates that might refer to any of these endpoints.
However, some experts are considering this – the most meaningful measure is a live birth, or the number of babies born per treatment cycle.
In contrast, we can say that using pregnancy rate (positive test or ultrasound) can be a bit misleading, since not every pregnancy goes to term.
This is why fertility specialists advise patients to ask for live-birth rates (not just pregnancy rates) and to consider cumulative outcomes over multiple cycles.
Why? Well, simply because different success metrics can give different numbers. For instance, success per cycle started will look lower than success per embryo transferred, because it includes early failures. Should we consider all three metrics: live births per cycle started (intended retrieval), per actual egg retrieval, and per transfer?
We’ll explain these and other key terms below.
Understanding each step of IVF, and why outcomes vary
Every IVF cycle has multiple stages where outcomes can change. At each stage – some patients no longer continue.
The main steps are:
stimulation (cycle start) →
egg retrieval →
fertilization →
embryo development →
transfer →
implantation →
clinical pregnancy →
live birth.
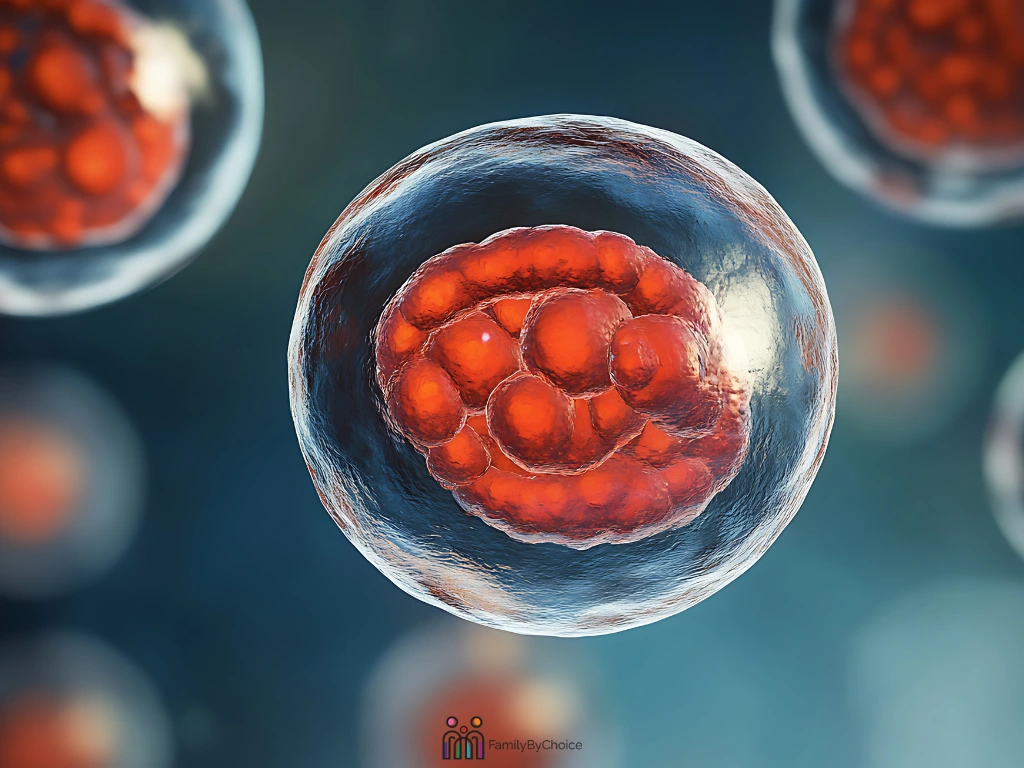
Below is a simplified illustration of early embryo development stages:
Each step reduces numbers, which explains why different metrics vary.
For example, let’s suppose that 12 eggs are retrieved and 10 are mature. About 80% of those might fertilize, yielding ~8 embryos. These embryos are then cultured for 3 to 5 days.
Roughly 30 to 50% of embryos present on Day 3 will actually make it to a healthy Day 5 blastocyst stage. In this example, only 3 to 4 embryos might reach transfer. Even after transfer, not all embryos implant. A high-quality single blastocyst from a woman under 37 might have roughly a 50 to 55% chance to implant and yield a pregnancy; in older women might be even lower.
Among those implanted pregnancies, some miscarry (often early, so not every clinical pregnancy becomes a live birth). So, a fertility doctor will point out multiple “drop-offs” along the way: not everyone who starts will retrieve eggs, not every egg fertilizes, not every embryo survives to transfer, not every transfer implants, and not every pregnancy delivers.
This cascade means success rates per transfer will be higher than per cycle started, and cumulative live-birth rates (over several cycles) often paint a more realistic picture of a patient’s chances.
Key IVF Success Metrics (Glossary)
Chemical (biochemical) pregnancy / positive hCG
A very early pregnancy detected only by a hormone test, before any ultrasound evidence. This is sometimes called a “chemical pregnancy” – it means you tested positive (hCG present), but pregnancy stops before the 5th week. Many IVF patients have a positive test that then goes away. Still, it’s counted as pregnancy, just not as clinical pregnancy.
Clinical pregnancy
Pregnancy confirmed by ultrasound (e.g. a gestational sac or fetal heartbeat) is a clinical pregnancy. Most clinics count success from clinical pregnancy onward rather than just a positive test.
Live birth
The delivery of a baby (or babies) with at least one born alive. This is the ultimate goal. Some agencies define success in live birth if we have a live-born infant delivered at ≥37 weeks.
Live birth per cycle started
The percent of all IVF cycles that began (patient took stimulation meds) resulted in a live birth. This includes cancellations and all losses, so it is the most conservative measure of a program’s overall success.
Live birth per egg retrieval
The percent of cycles where eggs were retrieved (and at least one egg collected) that result in a live birth.
Live birth per embryo transfer
The percent of embryo transfer procedures that result in a live birth. This is usually the highest rate because only cycles that made it to transfer are counted, excluding earlier losses. For example, if 100 women start a cycle, 80 reach retrieval, 50 get to transfer, and 15 babies are born, then live birth rates are 15% per start, 18.75% per retrieval, and 30% per transfer.
Some clinics will present multiple rates (per start, per retrieval, per transfer) so patients can see the comparisons.
Implantation rate
The number of gestational sacs (or fetal heartbeats) seen on ultrasound divided by the number of embryos transferred. It measures how often a transferred embryo implants. Implantation rates tend to be higher than live-birth rates, because not every implanting embryo leads to delivery. For example, a single pregnancy can involve 1–2 implanted sacs (in case of twins).
Cumulative live birth rate
The chance of having a baby after all transfers from one retrieval (or multiple cycles) are done. For example, a couple might conceive on the 2nd or 3rd transfer. When clinics or studies quote a “cumulative success,” they can also mean the percent having a live birth after multiple cycles/transfers.
Elective Single Embryo Transfer (SET) and multiple birth rate
A clinic’s SET rate tells you how often they transfer only one embryo at a time. The multiple birth rate is the percent of IVF live births that were twins (or higher-order).
From what we know so far, some clinics labeled as “good” might have a high SET rate and low multiple rate. But, for some clinics, the gold standard for an IVF cycle remains just live birth at term.

IVF Success by Age (Why Age-Specific Data Matters)
Female age is usually a factor in IVF success. The general opinion is that younger women have many more and higher-quality eggs, and in most cases, this is true. To simplify age-specific data, clinics will say that women under 35 have by far the highest chances per cycle, those aged 35–39 drop into intermediate ranges; and those 40+ have lower chances.
For example, recent SART data (2023) show that cumulative live birth per started cycle (all transfers) averaged about 43% for women under 35, 19% for ages 38–40, and only ~3% for women over 42.
Even within an age bracket, individual factors cause variability.
Therefore clinics always publish age-stratified success rates, but you shouldn’t always compare your situation to data in your age group.
SART data provided averages, so we need to remember that. The reality is – some young women will have poor egg reserve, and some older women might have better-than-average outcomes.
The key might be considering a range, not holding on to a promise built on averages.
Own Eggs vs. Donor Eggs/Embryos
If you use your own eggs, age plays the dominant role. All the above age-based rates apply to own eggs. If success is low (e.g. due to very low ovarian reserve or poor egg quality), a specialist might suggest donor eggs or donor embryos.
Donor eggs are typically from young women (often <30), so a recipient’s age becomes less relevant. Indeed, the CDC notes that success with donor eggs is reported per transfer, not by recipient age, because younger donor eggs yield similar outcomes across ages.
Put simply, “it’s the age of the egg that matters”. For example, a woman in her 40s receiving a 25-year-old donor’s eggs could have success rates comparable to a 25-year-old using her own eggs.
Also, clinics may recommend donors if a woman has very low ovarian reserve or has failed multiple cycles. This is a medical option rather than a mandate, and in many cases, patients are feel free to discuss it openly without feeling pressured.
If a donor is used, be sure to clarify how the clinic reports those outcomes. Also note that donor success rates tend to be high: for some clinics, live birth rates per transfer with donor eggs often exceed 50%, reflecting the donors’ young age.
Fresh vs. Frozen Embryo Transfer
IVF transfers can be fresh (embryos transferred in the same cycle as retrieval) or frozen (FET), in which case we have embryos vitrified and transferred later. Outcomes may differ.
Fresh cycles give a faster timeline, but the woman’s hormones play the role too. Frozen transfers are more similar to natural conception pregnancies, and some centers find results in increased implantation rates, increased ongoing pregnancy rates, increased live birth rates, decreased miscarriage rates, lowered risk of pre-term labor and healthier babies.
However, success per cycle is usually an average – not a guarantee.
Where does reporting matter? Well, for example, if a clinic does a “freeze-all” strategy (freezing all embryos and transferring later), then many fresh cycles will show “no transfer” in that reporting year. This can artificially lower that year’s success rate. Always ask how frozen embryo transfers are counted in reported rates. Ideally, a clinic’s stats will combine fresh and subsequent frozen transfers to show cumulative success, or separate the data for more accurate average results.
Embryo Quality and Lab Factors
Not all embryos are equal. Embryologists assign grades to embryos based on appearance. For example, cell number, symmetry, fragmentation on Day 3; blastocyst expansion and inner cell mass/trophectoderm quality on Day 5.
Higher-grade embryos tend to implant better. In one study, embryos with a “top” grade had significantly higher clinical pregnancy and live birth rates than lower-grade embryos.
However, grading is an imperfect tool: it cannot see the embryo’s DNA or the uterine environment. We need to be aware that genetic makeup is most important, and this is why some clinics make genetic screening mandatory.
Day 3 vs Day 5 transfers
Many labs culture embryos to Day 5 (blastocyst) before transfer, because surviving to blastocyst is an universal sign of embryo strength. Some clinics report that only 30–50% of fertilized embryos will make it from Day 3 to a Day 5 blastocyst.
Transferring at Day 5 means you transfer more robust embryos, often improving implantation rates per embryo. For example, SART reports ~56% implantation per embryo under 35, a number consistent with blastocyst transfers. If a patient has very few embryos, a Day 3 transfer might be chosen to avoid having no embryos. Now you understand why Day 5 is typically preferred for selection.
Lab quality and expertise as a factor
The conditions in the IVF lab – incubators, culture media, equipment, and the skill of the embryologists also influence success. A well-equipped, experienced lab may have slightly higher embryo survival and development rates. Unfortunately, there’s no public scorecard for “lab quality.” When researching clinics, you can look for transparency (e.g. do they describe their lab process) and whether their outcomes seem in line with other reputable centers.
PGT-A (Genetic Testing of Embryos): Benefits and Limits
What it does: PGT-A (preimplantation genetic testing for aneuploidy) means biopsying an embryo (usually at blastocyst stage) to check its chromosome count. It can identify embryos with normal (euploid) chromosome sets versus those with abnormalities.
Transferring a chromosomally normal embryo could affect the chance of implantation and reduce the miscarriage risk. In practice, clinics use PGT-A to select the healthiest embryo(s) to transfer.
Many studies show that PGT-A can reduce miscarriage rates and shorten time to pregnancy, especially in women over 36 or with prior losses.
Some reports say that about half of embryos in older women are aneuploid, so PGT-A can reduce the number of transferring those. It is also considered that by transferring only euploid embryos, a couple may achieve pregnancy in fewer cycles.
What PGT-A can’t do
PGT-A does not guarantee a baby. It cannot fix an embryo; it only selects among those created. The fact is that this procedure adds cost and requires an embryo biopsy (which carries a small risk of embryo damage).
Also, testing is still not 100% accurate: some embryos are mosaic (partly normal, partly abnormal), leading to false positives or negatives. For example, an embryo with a small abnormal cell line could be labeled “abnormal” and discarded even though it might have led to a healthy baby.
Importantly, even after selecting a euploid embryo, implantation and pregnancy are not certain. Finally, PGT-A is typically offered to certain patients (advanced age, recurrent IVF failure, recurrent miscarriage) in consultation with a specialist. Today, it’s still an option, not a must.
In summary: PGT-A can increase per-transfer success and reduce miscarriages in the right circumstances, but it doesn’t raise the overall chance of having a baby in general. It should be considered as one tool, with informed understanding of its limits.
Still having questions about Genetic Testing of Embryos?
Check our course Testing for Health – The Science Behind Embryo Screening
Single Embryo Transfer & Multiple Births
A higher success rate per transfer might seem good, but only if it doesn’t come at the cost of multiple births. Transferring two or more embryos at once can double a clinic’s pregnancy rate, but it dramatically increases twins/triplets.
Multiple pregnancies carry much higher risks: preterm birth, low birth weight, maternal complications, etc. For this reason, some clinics aim to minimize multiples.
Let’s present this with an example.
Imagine two IVF clinics reporting their success rates for women under 35.
Clinic A
- Reports a 55% pregnancy rate per embryo transfer
- Often transfers two embryos at once
- Results:
- 35% singleton births
- 20% twin births
- Total “success” looks high
Clinic B
- Reports a 45% live birth rate per embryo transfer
- Uses single embryo transfer (SET) whenever medically appropriate
- Results:
- 43% singleton births
- 2% twin births
- Almost no triplets
At first glance, Clinic A may appear “more successful” because the pregnancy rate per transfer is higher. But when you look closer, the picture changes.
Clinic A’s higher rate is partly driven by transferring multiple embryos. This increases the chance that at least one embryo implants, but it also greatly increases the likelihood of twins.
Clinic B’s approach focuses on one healthy embryo, one healthy pregnancy and one healthy baby.
Multiple pregnancies are not just “two babies at once.” They come with higher risk of premature birth, increased NICU stays, higher medical risks for the pregnant person and/or higher long-term health risks for babies.
To make a conclusion here – a clinic with lower multiple birth rates, higher single embryo transfer use and slightly lower per-transfer success numbers may actually be delivering better, safer outcomes overall.
That’s why it’s important to look beyond a single success percentage and ask:
- How many embryos are usually transferred?
- What percentage of births are twins or higher-order multiples?
- Does this clinic prioritize singleton pregnancies and in what situations?

Reading Clinic Success Stats Like a Pro
So far, we concluded that IVF success statistics can be confusing.
To interpret them correctly, always compare “apples to apples”. Make sure you’re looking at the same metric for the same patient group.
For example:
- Compare live birth per started cycle in <35 women between two clinics, not a clinic’s “best-case” report of live birth per transfer in any age.
- Check whether the rates are per cycle start (the broadest denominator), per retrieval, or per transfer. Be wary if a clinic touts only a per-transfer or per-embryo rate (these will look much higher) without giving the per-cycle rate.
- Compare matching age groups and egg source: if one clinic’s 50% number is for under-35 with fresh cycles only, don’t compare it to another clinic’s 45% that includes older patients or donor cycles. Use the data for your specific scenario (age, diagnosis, own vs donor eggs, fresh vs frozen).
- Check sample sizes! Rates based on very few patients can be misleading. A clinic that has 2 of 3 patients succeed might say “66% success”. Not very meaningful. Ideally use averages over many cycles or multi-year data.
- Watch for cherry-picking. For example, asking “What’s your top success rate?” might yield something like “We had a 60% live birth rate this year for 36–37-year-olds using fresh IVF”, but that could exclude frozen cycles or tough cases. Look for transparency.
Clinic summary reports should be used to inform discussions, not to rank clinics directly. Also, be aware that different clinics treat different patient populations (some may take only ideal-prognosis cases, others treat the toughest cases). A high rate doesn’t automatically mean a clinic is “better”; it might mean they see easier cases or use multiples more than other clinics.
In practice, ask the clinic these specific questions:
“For someone my age using (own or donor) eggs, what is your expected live birth rate per cycle started? And what is the cumulative success after all transfers from one retrieval?”
“Out of patients like me, what percentage reach the embryo transfer stage?” (This reveals how many drop out earlier.)
“What is your elective single-embryo-transfer policy? What percentage of your live births were twins or higher?”
“How do you report frozen embryo transfers? Are those included in the same cycle outcome or counted separately?”
Getting clear answers, ideally with numbers, will help you compare metrics on equal footing. Remember to check whether the data are cumulative or per-cycle, and for how many patients. A trustworthy clinic will welcome these questions with understanding.
Personal Factors That Affect Your Odds
No two patients are identical. Besides age, many personal factors shape your IVF prognosis. A 30-year-old with good ovarian reserve, regular cycles, and a healthy partner will likely have much higher odds than a 30-year-old with very low reserve or uterine issues.
Recent reviews identify the key predictors of IVF success: age, duration of infertility, body mass index (BMI), ovarian reserve markers (like antral follicle count or AMH level), previous pregnancy history, diagnosis (cause of infertility), semen quality, and embryo quality/day of transfer.
Let’s break this down.
Ovarian reserve
Tests like AMH or early follicle counts estimate how many eggs remain. A low ovarian reserve often means fewer eggs retrieved, which can lead to lowers chances. That said, even women with low reserves can sometimes conceive if the eggs they do have are good.
Uterine and other diagnoses
Uterine factors such as submucosal fibroids, endometrial polyps, intrauterine scarring, or a thin endometrial lining have been associated with lower embryo implantation and pregnancy rates in IVF, because they can alter the uterine environment or physically interfere with the embryo’s ability to attach and grow. Also, conditions like endometriosis may affect egg quality.
Male factors (low sperm count or motility) often require ICSI but can still lead to success. However, severe male-factor may lower fertilization rates. If you have a specific diagnosis, ask openly how it typically impacts success.
Prior pregnancies: If you’ve had a previous baby (or even a successful IVF attempt in the past), that can be a positive sign. Women who have carried a child before tend to do better in IVF than those who’ve never been pregnant.
Length of infertility: Longer infertility often suggests underlying issues. Couples trying for many years without success generally have lower instantaneous odds.
Lifestyle and health: BMI, smoking, and general health matter. Women with very high or low BMI may have more difficulty. Smoking is also related to poor egg quality and quantity. Excess caffeine or alcohol is discouraged during IVF. Both partners should strive for healthy habits (balanced diet, exercise, folic acid for women, quitting tobacco) to optimize success.
Because so many factors interplay, two women of the same age can have different odds. The best approach is to get a personalized assessment from your doctor (often using predictive calculators) and then use clinic stats as general guides, not promises or rules.

Preparing to Talk with Your Doctor
When meeting your fertility specialist, it helps to be informed and ask targeted questions.
You might say: “Based on my age and situation (own eggs vs donor, any specific diagnosis), what live-birth rate do you expect per cycle and cumulatively?
How many of your patients like me end up getting an embryo transfer?
What is your single-embryo transfer policy and resulting multiple birth rate?
And how are frozen embryo transfers counted in your numbers?”
Asking for specifics, like live birth per cycle, per retrieval, cumulative, can help you understand exactly what the data mean.
Make sure the doctor explains whether reported success is “per cycle started” (which includes canceled cycles) or “per transfer.” Ask if the data include both fresh and frozen transfers together. For example, if a clinic follows a freeze-all approach, some transfers may be delayed into the next reporting period.
Ultimately, use these questions to gauge how well you fit the clinic’s average patient profile. Success rates are not guarantees, but knowing the numbers for someone like you (age, egg source, any special factors) helps in planning.
Remember, a single percentage is not your personal destiny. It’s an average of many patients, and your individual odds may be higher or lower depending on your unique factors.
A Realistic, Hopeful Outlook
It’s important to keep perspective: one IVF cycle is rarely the whole story. Many intended parents need 2–3 cycles (or more) before achieving pregnancy.
Cumulative success curves show that the chance of having a baby increases over multiple tries.
Use the clinic’s statistics as a planning guide, not a verdict.
Focus on informed planning: understand your likely range of outcomes, ask questions, and build a treatment plan (and support system) that does not hinge on a single number.
Stay optimistic and flexible. Medicine is advancing, and even challenging cases succeed.
Knowing the real definitions and stats behind IVF success empowers you to make the best decisions for your journey.
You are not alone in this process , lean on your healthcare team, counselors, and support communities. By staying informed and asking the right questions, you can navigate IVF with clarity, confidence, and hope.
Family By Choice offers information about what factors contribute to the success of an IVF cycle, and what is the average success rate for IVF, and how it varies based on age or other individual factors in the “IVF: Everything you need to know “ course.
In the course “Testing for Health – The Science Behind Embryo Screening”, we offer info about how PGT improves IVF success rates or reduces miscarriage risk.
Our course, “Artificial Intelligence (AI) in Fertility – Transforming Reproductive Medicine” can give you an insight into how machine learning models are used to predict embryo viability and implantation success in IVF. Also, our blog on How Artificial Intelligence Is Revolutionizing Fertility and Reproductive Medicine might be a useful read.
To listen to these courses, check Family By Choice membership options, or download the Family By Choice Learning Platform app.
Related Articles:
ICSI vs IVF
Deciding between conventional IVF insemination and intracytoplasmic sperm injection (ICSI) can be overwhelming for future parents. In this article, we’ll explain what each method involves, their benefits and limits.
IVF failed? Understand your real next options: from trying IVF again to donor eggs, surrogacy, or stepping back. A clear, compassionate guide helping intended parents make informed decisions after an unsuccessful cycle.
Deciding whether to continue IVF with your own eggs or move to donor eggs is one of the most emotionally complex choices in fertility treatment. Read more to find all the answers before making a decision.
A complete guide to the questions intended parents ask when choosing an egg donor, covering medical, genetic, legal, financial, practical, and emotional considerations to help you feel informed, grounded, and confident.
Researching reciprocal IVF guide for lesbian couples? Learn how shared motherhood works! From choosing who provides eggs and who carries, to donor sperm. All fertility challenges, reciprocal IVF costs, and legal considerations covered! Read more now.